
Simulating Bonding Curves
04.07.2023
Download the model: Bonding Curve Models on GitHub
Bonding curves enable the price of a token to change with the quantity in circulation. They are used throughout DeFi because they uniquely enable both dynamic pricing and automatic liquidity. The concept for bonding curves were first published in 2016 by Bancor and Simon de la Rouviere. In 2017, Alan Lu published a Medium post introducing the first constant product (x * y = k) bonding curve design, which has since been made famous by Uniswap and other DEX's that use this style of bonding curves to facilitate swaps.
Bonding curves have become foundational in DeFi but have struggled to find their footing with NFTs. Likely reasons include:
- Limited ability for speculation. Bonding curves effectively preset a rate of appreciation. NFTs are better suited for order books that simultaneously enable buy-and-hold behavior and rapid floor price growth.
- Trapped liquidity. Bonding curves provide automatic liquidity by retaining sale volume in the contract so that collectors can sell back to the curve. DeFi has effectively incentivized external liquidity providers via trading fees to solve this problem; however, only Sudoswap has created a somewhat comparable model in NFTs.
- Difficult to understand. NFTs typically skew towards more novice crypto users. An order book is intuitive, bonding curves are not. People trade are more likely to transact with things they understand.
Despite these challenges, bonding curves solve for a few key pain points with NFTs as well:
- Ability to exit. The guarantee to get some, if not all, of your money back solves for the key painpoint for collectors - losing all their money (lol).
- Better price discovery. Most initial prices for NFTs are set randomly and create inefficient markets (gas price auctions, massive pops on secondaries, significant oversupply are all indications of a bad initial sale prices). Bonding curves effectively enable collectors to set an equilibrium price by buying to the point of maximum demand.
You can read more about the merits of bonding curves in Decent's post launching our bonding curve mechanism, Crescendo: Introducing Crescendo.
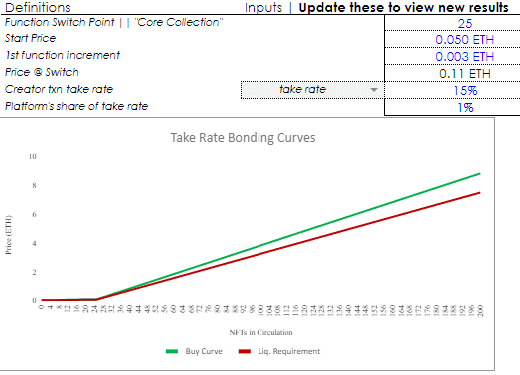
To better understand decision making for creators and collectors with bonding curves, I've created this model.
Three conclusions
Based on this model, we can make three surprising conclusions to better inform future designs for NFT bonding curves:
- Traditional research really likes Sigmoid curves to mimic to maximize momentum trading, but we found a piecewise linear or straight linear curve works best for realistic applications + collector preferences. For the uninitiated, this is a good article on curve shapes.
- (most important) Because most creators take a 10%+ royalty on buys & collectors have (mostly) 15%+ ROI hurdles, people sell much less than you'd think. This opens up profitable LP strategies for those willing to bet on low redemptions. This is BIG because solves for trapped liquidity!!
- (most surprising) Creators can actually increase their overall EV by sharing rights to claim a significant % of the liquidity balance with collectors! This strategy sufficiently boosts collector EV such that the curve does way more GMV making all parties better off.
Overall, I'm a big fan of bonding curves for NFTs. I think there is significant room for improvement in the mechanism designs, which builders should see as an exciting opportunity. The biggest risk is that bonding curves will always remain too complicated for NFTs most important use case, which is to onboard more people to crypto.